Point By Point
We can draw the graph of a parabola by taking all the integer values of  shown on the axis, calculate the corresponding
  value for each, plot each point in turn and join them with a smooth curve.

This method is not very efficient.
Using Special Points
Another way is to calculate the special points of the parabola and plot only those.
The special points are:
- -intercept
- vertex
- -intercepts (if there are any)
- symmetry of the -intercept

The special points can be calculated quite easily from the quadratic expression given in factored form or in completed square form.
Special Points from Factored Form
Example

The intercept occurs when the coordinate is zero. Therefore when  :
:
![\[y=(x-3)(x+5)=(0-3)(0+5)=(-3)(5)=-15\]](https://tentotwelvemath.com/wp-content/ql-cache/quicklatex.com-4ef608f33c64247c62568e227dc182fb_l3.png "Rendered by QuickLaTeX.com")
The -intercept is the point  .
.
The -intercepts occur when the coordinate is zero. To locate them, we need to solve the equation
![\[0=(x-3)(x+5)\]](https://tentotwelvemath.com/wp-content/ql-cache/quicklatex.com-6995493dc460da12cad546f63a10d01c_l3.png "Rendered by QuickLaTeX.com")
When any two numbers multiply to give zero, one or the other or both of the numbers must be zero. Therefore, if
![\begin{align*}0&=(x-3)(x+5)\\[10 pt] 0&=x-3 \text{ or } & 0&=x+5\\[10 pt] \Rightarrow x&=3 &\Rightarrow x&=-5\end{align}](https://tentotwelvemath.com/wp-content/ql-cache/quicklatex.com-e63ab450af28163aadfcd1540eb230e8_l3.png "Rendered by QuickLaTeX.com")
The -intercepts occur at the points  and
and  .
.
Vertex: The coordinate of the vertex is right in the middle of the intercepts. To find the middle of  and
and  , we can do a variety of calculations. One way is to add them together and divide by 2 (find the average of the two numbers).
![\[x_{\text{vertex}}=\dfrac{-5+3}{2}=\dfrac{-2}{2}=-1\]](https://tentotwelvemath.com/wp-content/ql-cache/quicklatex.com-0a8dfc87a40d0aeff9c0524353b1cc55_l3.png "Rendered by QuickLaTeX.com")
Now to find the coordinate of the vertex, we simply substitute the coordinate into the equation for . When  :
:
![\[y=(x-3)(x+5)=(-1-3)(-1+5)=(-4)(4)=-16\]](https://tentotwelvemath.com/wp-content/ql-cache/quicklatex.com-8fd11da84f6715293ef30118dd03c780_l3.png "Rendered by QuickLaTeX.com")
![\[y_{\text{vertex}}=-16\]](https://tentotwelvemath.com/wp-content/ql-cache/quicklatex.com-e7e046d2c3473cb5891cb17fd4115bf4_l3.png "Rendered by QuickLaTeX.com")
The coordinates of the vertex are  .
.
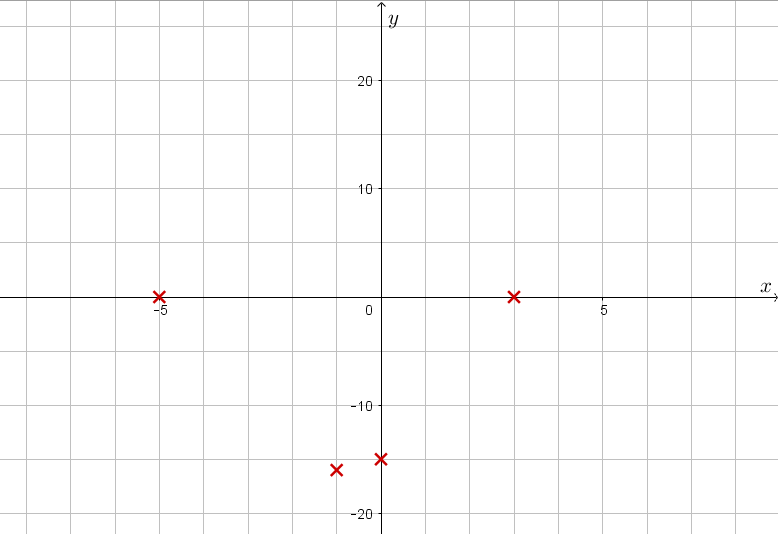
Let’s plot the points  :
:
The last point to plot is the symmetry of the intercept. If you imagine a mirror line through the vertex, and reflect the intercept over that to plot a fifth point.
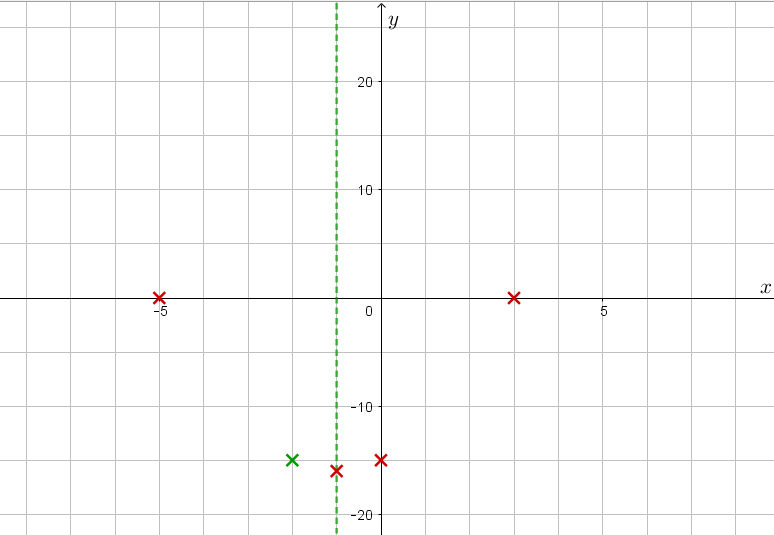
We are now ready to draw a smooth curve through the plotted points, making sure to round off the vertex and not make it too pointy.

Special Points from Completed Square form:
We calculate the same special points, however our calculations look slightly different as our equation is presented differently.
Let’s graph the parabola  .
.
The -intercept: The point on the parabola that lies on the -axis has . We substitute into the equation:
![\begin{align*}y&=(x-3)^2-8\\[10 pt]&=(0-3)^2-8\\[10 pt]&=(-3)^2-8\\[10 pt]&=9-8=1\end{align}](https://tentotwelvemath.com/wp-content/ql-cache/quicklatex.com-313390a25288191cf6eb58e446bb8a97_l3.png "Rendered by QuickLaTeX.com")
The -intercept has coordinates 
The -intercepts: We substitute  and solve directly, remembering that when we take a square root we must remember to consider both the positive and the negative square root. For example, if we know that
  we know that both and
  are solutions.
![\begin{align*}y&=(x-3)^2-8\\[10 pt]0&=(x-3)^2-8\\[10 pt]8&=(x-3)^2\end{align}](https://tentotwelvemath.com/wp-content/ql-cache/quicklatex.com-208000c07b7cb0b3496a16ae873851bc_l3.png "Rendered by QuickLaTeX.com")
Now we take the square root and consider both negative and positive:
![\begin{align*}-\sqrt{8}&=x-3 &+\sqrt{8}&=x-3\\[10 pt]-\sqrt{8}+3&=x &\sqrt{8}+3&=x\\[10 pt]x&=0.17&x&=5.83\quad\text{2 d.p.}\end{align}](https://tentotwelvemath.com/wp-content/ql-cache/quicklatex.com-1cbc0f68969a45770dd2a6c8aac90cdf_l3.png "Rendered by QuickLaTeX.com")
Note that the exact value of these roots can be simplified:
![\[\pm\sqrt{8}+3=\pm\sqrt{4\times2}+3=\pm2\sqrt{2}+3\]](https://tentotwelvemath.com/wp-content/ql-cache/quicklatex.com-69d31c64dbb8946fbba9868038f68190_l3.png "Rendered by QuickLaTeX.com")
The -intercepts have coordinates  and
and  .
.
The vertex: The lowest point on the parabola has the lowest value. The lowest square number is zero. Since  , we require ‘something’ to be equal to zero.
In our case, . Solve  . The vertex has the coordinate
  .
.
To calculate the coordinate, as for any coordinate, we substitute the coordinate into the equation:
![\begin{align*}y&=(x-3)^2-8\\[10 pt]y&=(3-3)^2-8\\[10 pt]y&=0-8=-8\end{align*}](https://tentotwelvemath.com/wp-content/ql-cache/quicklatex.com-76a1143c4f13b86ec18ec4e136ecaf72_l3.png "Rendered by QuickLaTeX.com")
The coordinates of the vertex are  .
.
Let’s plot the points , , and on the axes:

…and draw the parabola:

Graph from standard form 
To graph directly from the standard form, we need to employ processes that occur later in this unit. In summary:
To calculate the intercept, again we set and find that  . Therefore the intercept has coordinates
  .
.
To calculate the intercepts, we need to use one of the following processes:
To calculate the coordinate of the vertex, we need to use one of these processes:
- use
 once the intercepts are known;
 - use the formula
 ;
; - write the expression in completed square form
We then substitute the coordinate into the equation to find the coordinate of the vertex.
These processes are discussed in the rest of the unit.
Top BC G11 Menu Number and Algebra Menu