Handout: FOM 12 5.3 Determine the Range
The range of the graph  is
is 

The two tranformations we can make to the  values are to
- multiply (or divide)
- add (or subtract
In general, a sinusoidal graph has equation  . It is only the values
  and
and  that alter the range of the graph.
Multiply
To draw the graph  we consider particular points (easy points), and multiply the coordinate by 3 as follows:
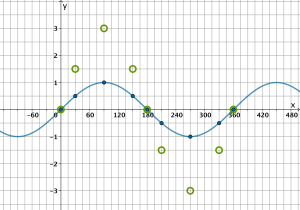
Track each point in turn. For example, on the blue line we have the point  therefore we plot the new point
  . The coordinate (that is,
  ) is multiplied by
  .
.
Next we draw a line through our new points:
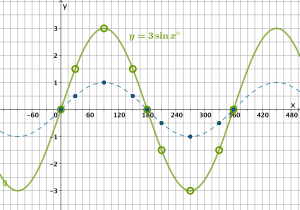
We see that the range of the green curve is  .
.
The amplitude of this curve is .
The sinusoidal axis is not changed, it is still  .
.
Add
To draw the graph  again we consider particular points and add 2 to the value as follows:

As before, track each point in turn. For example, the point on the blue curve at  will become the point
  .
.
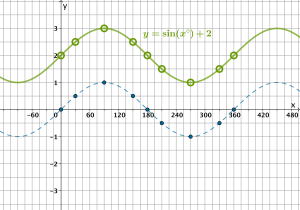
We see that the range of the green curve is  .
.
The sinusoidal axis is the horizontal line  .
.
The amplitude of the curve is not changed, it is still 1.
Try each transformation here:
Multiply and add
To do both operations, we should multiply first then add. However, in practice it is easier to draw a new sinusoidal axis, and plot the correct amplitude from there.
For example, transform  to
to  .
.
First, lets draw a new sinusoidal axis at 

Now let’s find the multiples of 180 on the line to plot our new ‘zeros’:
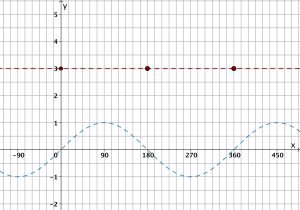
Now let’s track the multiples of 90, and plot our new max and min but remembering that the amplitude of  is 3, so we plot 3 above and below the sinusoidal axis:
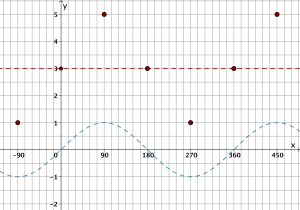
Finally, we can draw our curve and erase the sinusoidal axis:

The range of our new graph is  , which we can see is the same as
  .
.
In general, we can say that the range of the sinusoidal function is
![\[d-a \leq y \leq d+a\]](https://tentotwelvemath.com/wp-content/ql-cache/quicklatex.com-3b527615fb87b28606f951c6623aadde_l3.png "Rendered by QuickLaTeX.com")
(when is positive, otherwise the inequality is reversed).
Try both transformations together here:
Practice: Determine the range
CA1 Test out: Determine the range accuracy quiz
Practice: Match the graph
CA2 Test out: Match the graph