The objective of this project is to develop a deeper understanding of integers by creating and analyzing various polynomial and star diagrams.
In this project you are to look for the relationships that exist between the number of points on the circle  , the number used as the increment,
  , and the shape that is formed.
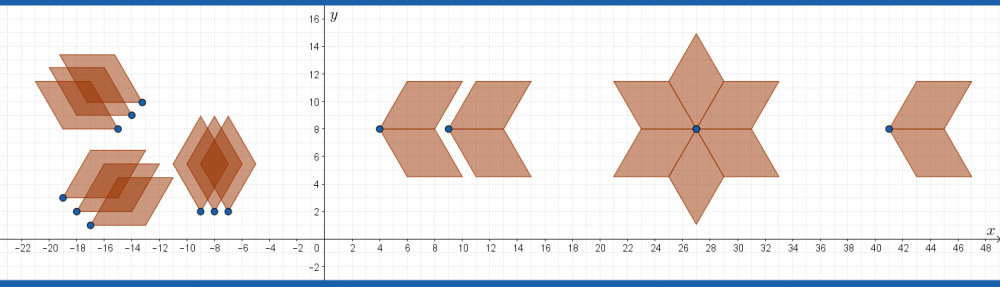
For example, in these three diagrams,  . There are 16 points around the circle. On the left,
  ; in the center
  and on the right
  .
.

Each value of gives a new diagram. The diagrams fall into three categories:
- a regular polygon;
- a star that visits every point on the circumference;
- a star that visits only some of the points on the circumference.
Your task is to explore different combinations of and to learn about the numerical structures that lie behind these diagrams. Use the applets provided below to create your diagrams.
You may complete this project as a document, a slide set or a poster.
Project Structure (google slides):
Slide 1: Title page with your name, date, project title and an introduction that states the objective of the project in your own words. Perhaps also a picture.
Section A: Circle with 12 dots. Create a diagram with increments of 1, another with 2, another with 3,another with 4, and finally with 5. Explain what occurs in each diagram. Explain why the increment of 5 looks very different than the others. Explain why the final stop is dot #60.
Section B: Choose a circle with either 15 or 24 dots. (i) Create a diagram that yields a polygon. (ii) Create a diagram that yields a star and uses all the dots. (iii) Create a diagram that yields a star that doesn’t use all the dots. Make sure you specify your value of and in each diagram.
Section C: Prediction. Choose a number between 24 and 100. Predict what increment will give you a polygon and how many sides. Predict what increment will give you a star that uses all dots. Predict what increment will give you a star that doesn’t use all dots. Give a reason for each prediction.
Section D: Validation or correction: Create a diagram for each of your predictions in section C. Explain whether or not your prediction for each diagram was correct.
Section E: Generalisations. Generalise, using for the number of dots, and for the increment, (i) when a polygon will occur, (ii) when a star that uses all dots will occur and finally (iii) when a star that uses some but not all dots will occur.
Applets to create your diagrams:
12 Point
15 Point
24 Point
n-Point